The Woodshed: North Carolina redistricting is like deja vu all over again
By Dallas Woodhouse, Carolina Journal
It’s one of the best quotes attributed to baseball legend Yogi Berra: "It's like deja vu all over again."
It’s also a phrase that sums up North Carolina’s political landscape going forward as new legislative and congressional district maps are approved by the Republican-led legislature along party-line votes.
Multiple groups have evaluated and rated the maps. The reasonable conclusion is that the partisan make-up of both legislative chambers and the North Carolina congressional delegation is likely to be strikingly similar to the past decade.
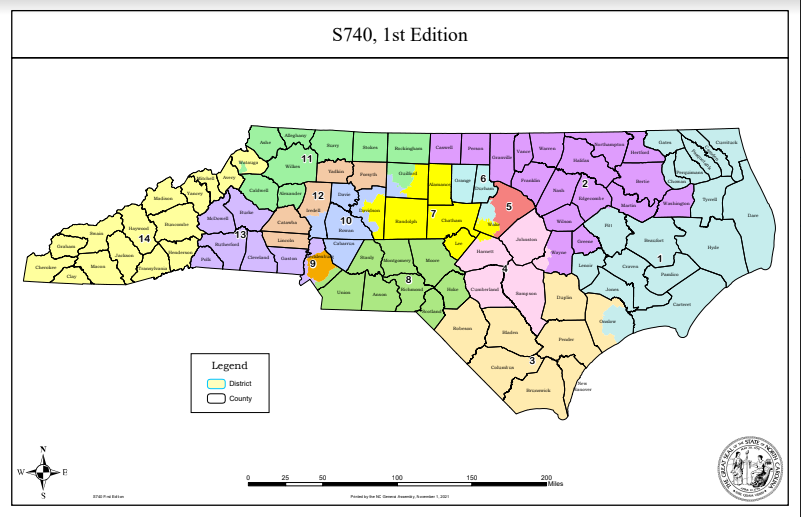
The N.C. congressional map
Beginning in 2023, North Carolina will have a total of 14 congressional seats, up from 13. Throughout most of the last decade, N.C. Republicans held 10 of the congressional seats; Democrats had three. Due to litigation, in 2019 the districts were re-drawn giving N.C. Democrats five of the current 13, the most seats they have held in a decade.
An analysis of the proposed congressional map by Dave’s Redistricting App, using election results data from 2016 and 2020, predicts the map would likely produce a 10-4 split in favor of Republicans. Princeton University also predicted a 10-4 GOP-favored result. According to Dave’s, the map would have eight safe Republican seats, three safe Democratic seats, and three competitive seats; two would lean right and one would lean left.
Accepting that analysis, the 10 GOP seats would be exactly what Republicans had most of the decade and the four for Democrats would be one more than they had for most of the decade.
If you assume that both political parties generally experience one strong wave election in their favor per decade, Republicans could hit a high of 11 seats and a low of eight seats. Democrats might hit a low of two seats and a high of six seats. Arguably, Democrats have more opportunity with this map than any time in the last decade.
Any way you slice it, this map is basically a status quo map that falls in the range of what North Carolina saw over the last decade.
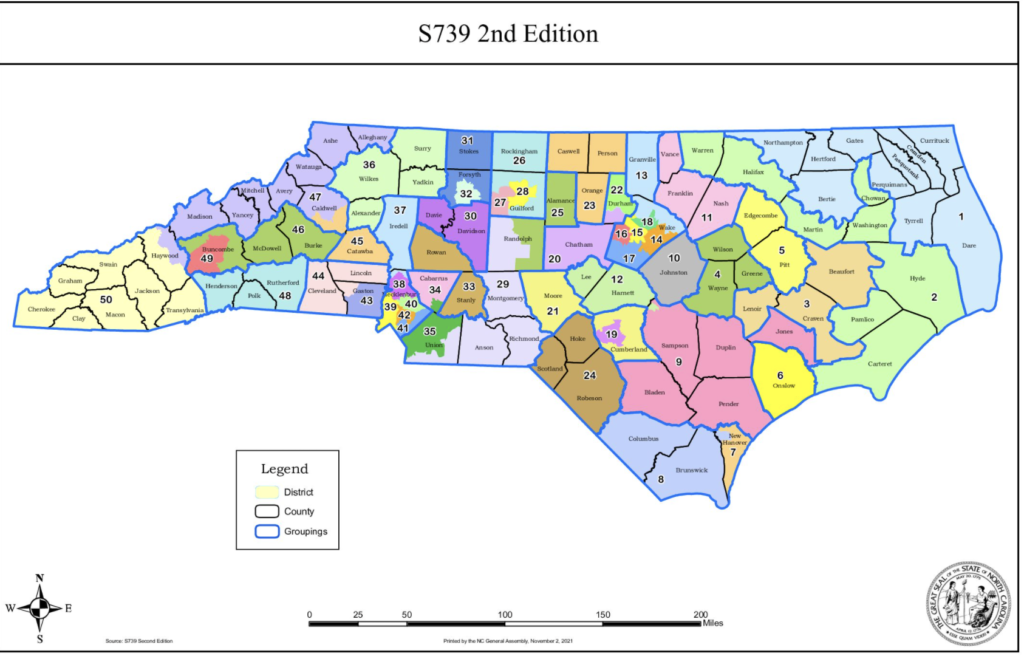
The N.C. Senate map
Princeton University also evaluated the proposed state Senate map. It predicts 30 Republicans, and 20 Democrats will likely be elected with this map in the 50-member chamber. This may overestimate Republican strength. Dave’s Redistricting App shows Gov. Cooper Roy Cooper won 23 and lost 27 of the proposed state Senate districts.
Dave's rates 23 districts as Republican, 19 as Democratic, and eight as competitive.
This map gives Democrats a real chance of taking the state Senate majority sometime in the next decade, although the results of the Nov. 2 election and the likely political environments in 2022 and 2024 make that less likely until 2026.
Fueled by Obamacare and stimulus outrage in 2010, Republicans won a supermajority in the state Senate with 33 Republicans. Note that the Republicans won more seats under a Democrat-drawn map than they are predicted to win under their new map.
While Republicans drew new districts in 2011, they ended up with the same 33-17 Republican split that they had the election before under Democrat maps. They did pick up one state Senate seat in 2014 and in 2016, hitting a high-water mark for the decade with 35 GOP senators and 15 Democrat senators. Fueled by a strong 2018, Democrats are at their high-water mark, currently with 22 senators and the GOP has a decade low of 28.
Again, if the predictions from Princeton are right, the 30 Republican senators would be well below the GOP’s high of 35 and slightly higher than the current 28. It is also less than the average number of GOP State senators over the past 12 years, which is 32.
The state House map is predicted to produce a 70-50 GOP split, according to Princeton.
“We'd expect it to elect a 70R-50D House, with 17 competitive seats. In fact, unlike a lot of the other maps we've seen this cycle, it doesn't appear to be explicitly avoiding the competitive zone,” the analysts said.
From 2011-21, Republicans averaged 71 house members in the 120-member chamber.]
The N.C. House map
The GOP won 67 seats under Democrat-drawn House maps in 2010. After new GOP House maps were put in place, Republicans hit a high mark of 77 seats in 2012. They won 74 seats over the next couple of cycles until the 2018 election brought them to a decade low of 65. They gained four seats in 2020 and currently hold 69 seats.
It's not unreasonable to think that, as the population moves throughout the next decade, Democrats could win a narrow majority despite their geographic difficulties.
Democrats would prefer maps more favorable to them. However, in a state that requires keeping counties whole, and the fact the Democrats are largely uncompetitive in 70 of North Carolina’s 100 counties, they would be at a sharp disadvantage no matter who drew the districts.
If Republicans capture veto-proof margins in the General Assembly — 30-Senate, 72-House — in 2022, they will do so mostly on the strength of a strong GOP year overall. Legislative maps are not, and can’t be, drawn to deliver Republicans a supermajority. Candidates of either party will have to win several pure toss-up races.
In the last decade, Republicans held supermajorities in both chambers from 2013-19, losing that critical advantage during the 2018 elections.
If the political winds are at their backs, Republicans may capture supermajorities in both chambers in 2022, as they did in 2012. If so, it would hold them through a couple of election cycles until the Democrats mount a comeback later in the decade, challenging them for majorities in both chambers just before we start all this counting and drawing again in 2030.
Berra was also quoted as saying: “The future ain’t what it used to be.”
For the next decade in North Carolina, the future may be very close to what it used to be.
The Woodshed, by investigative political analyst Dallas Woodhouse, is a unique blend of news and opinion based on his expertise and years of experience in North Carolina’s political trenches. For more follow him on Twitter at @DallasWoodhouse


